This is the 100th blog post on From the Holocron.
It’s a moment for celebration, even though it’s an arbitrary milestone.
100 blog posts represent a lot of work. Most posts are just over 1000 words. Some are a bit shorter, but many more run a few hundred words long. That means that there are somewhere around 100,000 words on this blog, which launched on the first day of 2018.
If this blog were a book, it would be just a bit shorter than Wuthering Heights by Emily Bronte and just a bit longer than To Kill a Mockingbird by Harper Lee. It would probably be somewhere between Ender’s Game by Orson Scott Card and The Adventures of Huckleberry Finn by Mark Twain.
So, what exactly have I posted?
It would be weird to just list the 100 articles, but I can give you a list of the tags that I put on my articles to give a general idea of what I’ve been writing.
Not counting this article:
94 are tagged as “Opinion.” Fun fact: this category is used to bring the article into the scrolling widget on the front page. This means that I, somehow, missed putting the tag on 5 of my posts. Oops!
19 are tagged as “History.” Fun fact: I have more opinions than I have histories.
18 are tagged as “Economics.” Fun fact: I didn’t think I had this many articles on economics.
15 bear the tag, “News.” Fun fact: I would have sworn that I wrote the article on E.I.T.I. last month, but apparently I wrote it back in January. Time really flies.
10 are tagged as “Politics.” Fun fact: I think these, in particular, are above average in quality, but they almost never get read. Go figure, they’re labeled with the tag, “politics.”
8 are labeled as “Questions,” which I try to answer.
7 are labeled “Literature,” which is somehow less than I expected.
And, only 5 are labeled “Star Wars,” which is strange, since something from Star Wars lent its name to the site. Fun fact: two-word category in WordPress put a hyphen in the relevant URL instead of doing the whole “%20” thing that seemingly every website does.
Now, I want to take a moment and talk about how the blog is doing. I’ve set up Google Analytics for my website, so I can give a detailed report about the activity that is spent on this site.
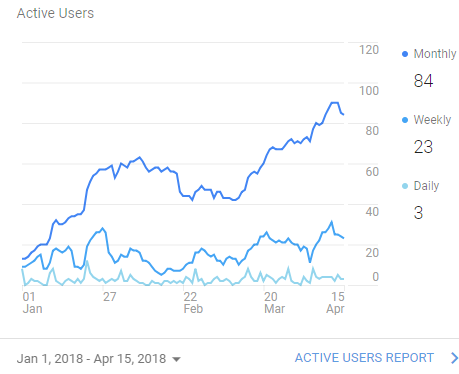
For instance, this is a graph of the active users from the launch on January 1st, to mid-April:

That’s not bad growth.
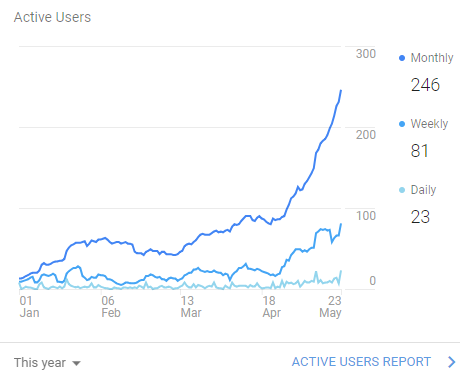
Here’s what happened in the last month:
That’s quite the slope.
On April 23rd, the website had 85 visitors in the past month.
On May 23rd, that number was up to 246.1
That’s almost 190% growth!
I would tell you that’s not sustainable, but I was thinking the same thing about the spike in early May, and here we are.
Now, I want to be able to make an accurate prediction of how many people will be on this website by the end of the year. In order to accomplish that, I need to run some regressions on the data in order to come up with an equation that can be applied to the future. After a little bit of Google searching, I discovered that you can do just that in Excel.
A little bit of elbow grease later, and I had my equation:
y=5.86+.91x
This equation was trash, with an r2 value of .67. I don’t fully understand this measure, but it’s a statistic that compares the data generated with the formula back against the original data in order to show how closely it matches. The closer it is to 1, the better.
So, I went a step further and, with the help of the Internet, figured out how to do a regression that would do an equation that took both x2 and x into account.
That spit out the following:
y=.012x2-.83x+47
This had an r2 of .84, which is much better, but still not great.
For fun, I used that equation to project out to December 31st of this year, and the formula suggested that there will be around 1343 visitors total in the 28 days leading up to the end of the year. That’s not bad and works out to an average daily user count of about 48, which would actually mean that the average day in December would shatter the previous record for most users in a day, with 22.
However, I decided to take things a step further. What might a cubic equation tell us about user growth?
I worked my magic again, and came up with:
y=.000291x3-.05067x2+2.79x+3.69
Miraculously, this had an r2 of .96, which is pretty close to 1, meaning that the formula closely corresponds to how things have gone so far.
The number of visitors in the previous 28 days on December 28th?
That’s almost exactly 300 visitors a day, which is hard to fathom at the moment. It would be really, really cool to see that happen.
Here’s why it won’t happen, at least like the formula thinks it will.
Google has fallen in love with my article on Animusic 3, and often shows it on the first page. I think I’ve accidentally found a niche where there are a lot of curious people (spurned backers of the project) and few articles with information on what happened.
Consequently, that article is my most viewed by far, racking up 270 page views since it was published in late February.
My article with the next most views is “How Many Backup Aircraft Exist?” with . . . 17.
So, most of my “growth,” is just more and more people looking at the Animusic 3 article. There’s nothing wrong with that, but it means that there’s a piece of the data that the formulas don’t see.
Where do I go from here?
I’m going to keep doing what I’ve been doing, but also try to do it better.
I’ve done stuff I’m genuinely proud of, and some stuff that doesn’t produce that feeling.
I’ve built up almost a week of articles in advance, with the goal of doing more drafts between the first and the published version.
I need to advertise more. There’s some good stuff here, but people don’t know about it.
And, finally, I need to figure out how to make some money off of this. My traffic still isn’t that high, but it’s grown enough to make me think that there’s something here. Only time will tell, but for now, I’m going to keep plugging away and hope for the best.


